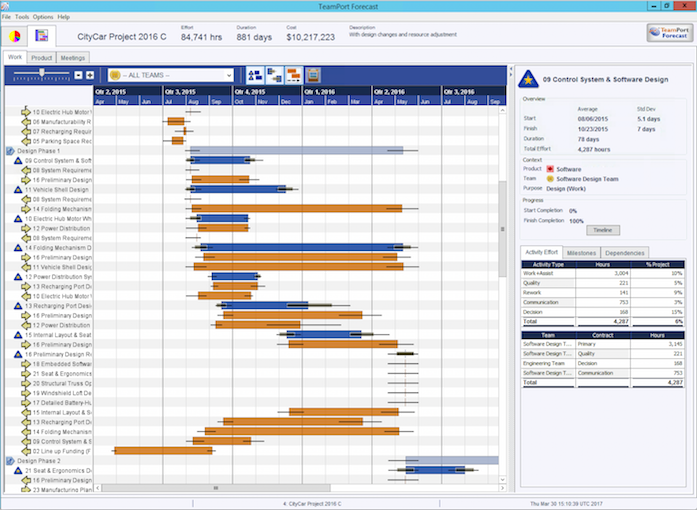
The Gantt chart views allow one to drill into details of the forecast to analyze decisions made during the design process. These deep dives will drive design iterations to optimize the model against your organization's goals, objectives, and constraints. In addition to traditional views of task start and stop, these TeamPort schedule charts also show uncertainty impact on schedule, coordination as activity, and intermediate forecast progress during activities.
Getting the most out of these charts takes time and experience, so be patient. The rich set of information presented can lead to many new discoveries.
The area to the right of the tab controls shows the project name and forecast results in effort, duration, and cost as well as a description as inputted at the time of simulation. The bottom of the forecast window also shows the project name and the date of the simulation.
The Gantt views come in three foci:
The main pane shows the project phases or products and their activities. A row isselected by clicking on the name (the name will not highlight).
The detail pane, when displayed, will show a further breakdown of the selected row. Note that some detail panes support additional graphs and charts. These charts are only available if the forecast was run with the Create Detailed Team Trends option selected in the Simulator Settings, Sampling sheet. The value of the information in the charts is improved with more runs in the simulation. A minimum of ten runs is recommended.

For more information on how to configure the Gantt views please see the article on Gantt view settings.
For more information on how to use the detail panes, please select from the list of detail panes in the help contents.